In this post we cover FACET, a new dataset created by Meta AI in order to evaluate a benchmark for fairness of computer vision models. Computer vision models are known to have biases that can impact their performance. For example, as we can see in the image below, given an image classification model, if we feed it with an image of a male soccer player, the model is likely to classify that image as a soccer player. However, if we introduce the model with a female soccer player, the model is more likely to be confused and may not classify the image correctly. This is just as an example for what fairness means, and later on, we’ll see real examples that FACET dataset helped to find.

The FACET dataset was presented in a research paper titled FACET: Fairness in Computer Vision Evaluation Benchmark, and in the rest of this post, we’ll explain the research paper to understand what kind of data this dataset has, what we can do with that, and how it was created.

If you prefer a video format, then we also covered most of what we cover in this post in the following video:
Exploring the FACET dataset
FACET Dataset Examples
Let’s start by exploring what kind of data we have in the FACET dataset. Following is one example of an image of a singer from the dataset.

In the singer image above, we can see that there is a box around the singer, which means we can use that dataset for object detection evaluation. And in the bottom right, we can see few more annotations, such as the class of the image which is a singer, the gender, which is male, a skin tone which here we see mostly light skin colors as the annotation, age group, provided as middle age, hair color, which is black, hair type, which is missing in this case, lightning and which part is visible, torso in this case.
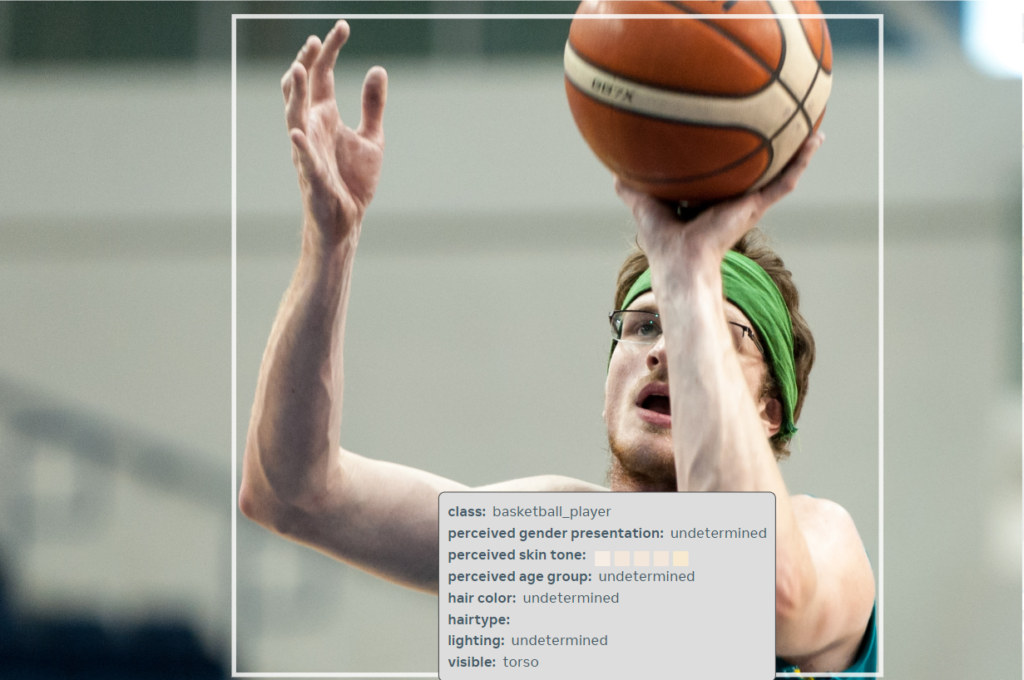
Another example is the below image of a basketball player, where again we see that the person location in the image is annotated with a box, and the same annotations as before are available, more of them are missing for this example as we can see with the “undetermined” value.
If you’d like to explore more images in the dataset you can do so in the dataset explorer available on the FACET explorer.

FACET Dataset Statistics
In the following table from the paper, we can see that the dataset contains 32k images and 50k people, so there are images with more than one person in them. Each person is annotated with a class such as the singer and basketball player we just saw, which can be used to evaluate image classification models. Each person is also surrounded with a bounding box, which can be used for object detection evaluation. The dataset also has 69k masks labeled as person, hair or clothing, which can be used to evaluate image segmentation models.
As we saw in the two image examples, there are also annotations for skin tone, age group and gender, which can be used to check disparity for certain protected groups. And there are various more attributes such as hair details, face masks, tattoo and lighting.

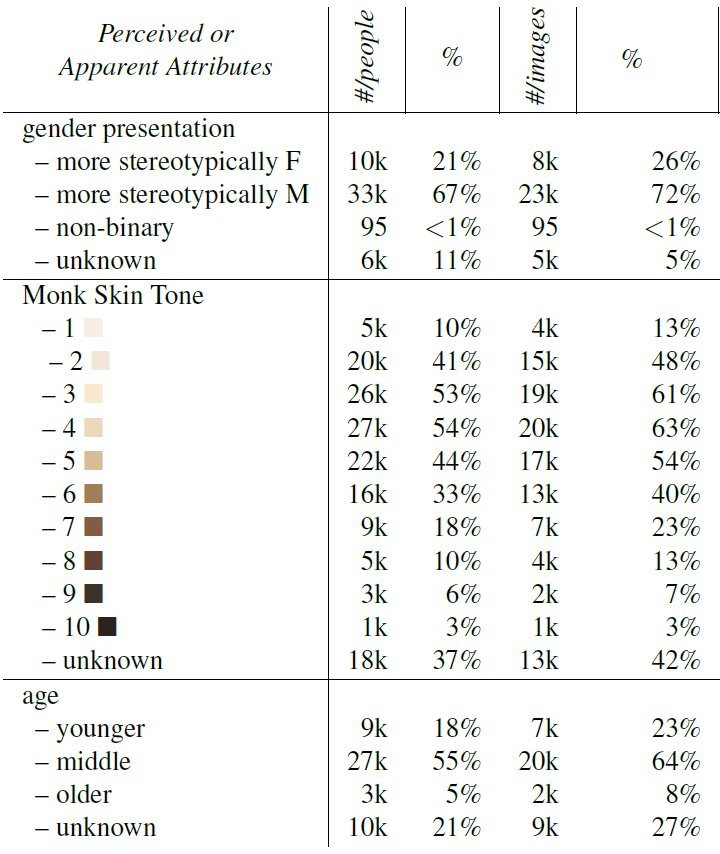
Another table from the paper which we can see below shows a breakdown of representation of the demographic groups in the dataset. Under the gender statistics we see that the majority of the persons and images are related to males. The skin tone seems to look quite as a normal distribution where there seems to be higher representation for lighter skin in levels 2-6. For the age group we see that the majority of persons are classified as middle age and low number of persons are classified as old.

How FACET was created?
Creating the 52 person categories
Let’s move on to see how the FACET dataset was created. First, the researchers created person-related categories, where they start from all children of the “person” word in WordNet, which is a hierarchical database of language concepts. For example, below we see the tree structure in WordNet for two of the final categories, judge and referee.

The categories are filtered based on overlapping with ImageNet classes. Since many models are trained on ImageNet and on other datasets with classes similar to ImageNet, this step helps to make the dataset a good fit for evaluation for such models. After few more filtering steps, such as removing categories with low number of samples and more, we get the final 52 categories.
Pipeline to create the FACET dataset

Then, as we see in the image above, to create the dataset of images the researchers start from 1 billion images from the Segment Anything 1B dataset. This set is filtered to images where caption or tags of the image in the Segment Anything dataset are related to the chosen 52 categories. This first step is an automatic pre-processing. Then there is another filtering step by categories, this time using human annotators. Then we get the 32k of images to annotate. Then after few annotation stages we get the FACET dataset, where the annotation stages are all done by humans.
FACET Annotation Stages

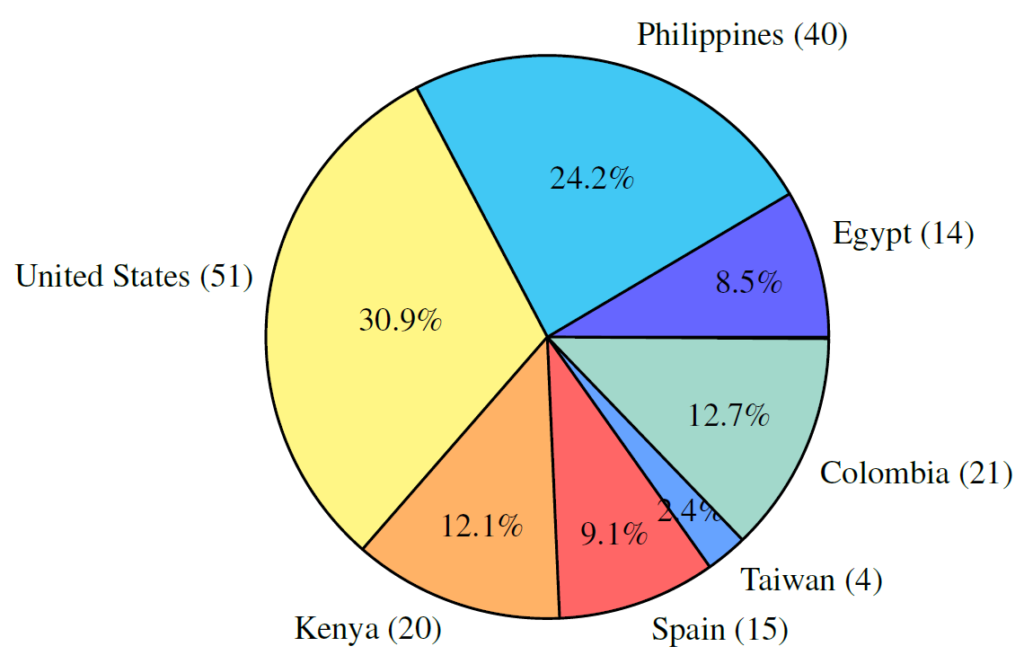
The annotation stages include first creating the bounding boxes and labeling each box from one of the 52 categories. Then, there is a dedicated step to annotate the skin tone where the annotations are aggregated from multiple annotators since they can be impacted from the annotator skin tone. Then, all other attributes are being annotated, and the last step is labeling the masks for object segmentation, where the masks are available since the images are taken from the Segment Anything dataset. To increase the diversity of the annotations, the annotators were selected from diverse locations as we can see in the following chart from the paper.

Results
Image Classification
Let’s now take a look at some of the results from the paper, starting from image classification, where the researchers calculated recall from CLIP, which is an image and text model from Open AI that can be used for zero shot image classification. The recall was calculated for each of the categories, for male and female labels. And in the following table we can see the categories where the diff in performance is the most significant. An interesting observation here is that CLIP did a much better job, more than 20% better, of classifying a dancer class for female dancers comparing to male dancers. Another interesting disparity is better performance for female nurse being more than 10% better. On the left side we see that CLIP did a better job classifying male gardeners and male laborers.

Object Detection
Another interesting result in the paper is for object detection task, where they try to answer whether a standard detection model struggles to detect people whose skin appears darker. As a standard detection model the researchers take a Faster R-CNN model that was pretrained on the COCO dataset.

In the following table we see the average recall of detecting a person by his skin tone, where the three columns represent different IoU values for the detected box comparing to the labeled box, and it is clear from the results that the model perform better for lighter skin tone comparing to darker skin tone.

Given the diverse set of annotations, many interesting questions such as the ones we saw here can be explored using the FACET model.
A strong computer vision model by Meta AI which would be very interesting to explore with FACET is DINOv2. We’ve explained DINOv2 paper here – https://aipapersacademy.com/dinov2-from-meta-ai-finally-a-foundational-model-in-computer-vision/
References
- Video – https://youtu.be/gk64qMMs00w
- Paper – https://arxiv.org/abs/2309.00035
- FACET Explorer – https://facet.metademolab.com/explorer
- We’ve used ChatPDF to help us analyze the paper (affiliate) – https://www.chatpdf.com/?via=ai-papers
All credit for the research goes to the researchers who wrote the paper we covered in this post.